As media viewership patterns get complex and personalized, using modern data platforms for viewer analytics helps organizations better understand their audiences. In this ebook, we will examine how viewer analytics can help organizations get business value, why most media analytics solutions fail and how Kyvos can resolve those issues by accelerating analytics on massive data on the cloud and on-premise data platforms.
Viewer analytics has always been challenging and expensive, increasing in complexity due to the exponential growth of data, evolving technologies, complicated consumption patterns and personalized content. As a result, analysts need tools that can meet their current requirements and help them adapt to the changing landscape with ease and speed.
Viewers tend to consume media on different devices and channels. Their viewing habits are not time-bound and depend on their personal schedules and preferences. Moreover, they expect made-to-order content that can meet their tastes and interests.
The entire media industry is constantly evolving. This makes predictions difficult, and it becomes necessary that insights arrive on time so that they are actionable.
Modern data platforms can capture detailed real-time information about every viewing experience. It is possible to track user behavior patterns, such as:
This viewership data can be analyzed against their demographic profiles, social media conversations and buying habits. The availability of a huge reservoir of data with multiple dimensions and extreme granularity empowers business analysts to understand their viewers better and build strategies that can work in a highly competitive environment.
Analytics on viewership data allows for building customer-focused business models by taking advantage of data-driven insights. It offers benefits like:
Insights from past campaigns help in designing better and more effective advertisements. Besides that, spending decisions based on data insights help optimize ad campaigns for maximum returns. They also help in smart negotiations for ad prices by advertisers and media companies.
Recognizing viewership patterns enables marketers to build customized campaigns targeted at specific audiences. They provide insights on new and emerging audience segments and their behavior, which can then be targeted to increase the customer base.
Understanding which content performs better and why helps align content with resonating with viewers. User profile data can be leveraged to instill meaningful personalization into content and build stronger relationships with customers. Business Intelligence from viewership data can help in improving customer loyalty by providing custom experiences and offering relevant recommendations.
Audience behavior and viewership analytics provide insights that push product improvements and new launches. The ability to track which devices are being used, when and where helps identify where developers should focus their efforts.
Analyzing granular historical data instead of samples can help identify patterns, predict audience behavior and build strategies based on those insights.
Businesses need rich, granular, reliable data at their disposal and the ability to get quick, actionable insights from it. Their key expectations include quick responses, ease of use and the availability of business intelligence to users at all levels across the organization.
The analytics platform should enable users to analyze viewership data across multiple dimensions. It should help them dive deep into every report to recognize hidden patterns, ask new questions and capitalize on every business opportunity.
If they are running a new ad campaign, they should be able to evaluate their ad placement strategies across different types of content, time of day, length of an ad, target geographies and audiences and device type.
If they are working on their marketing plan, they should be able to analyze historical data to identify what worked in the past and use it to predict what will work in the future.
Organizations require a solution that enables them to adapt quickly to new viewer segments, shifting consumption patterns, changes in the competitive landscape, new formats, emerging platforms and more.
Despite having the data and infrastructure in place, most BI and analytics platforms may fail to meet the needs of analysts. Let us examine some of the underlying reasons.
Analytics were simple when data was limited and could be easily referenced when needed. But when the volume of data increases to terabytes and petabytes, the same questions that were answered in a few seconds, take minutes or hours and sometimes, even days. This leads to a delay in analytics, and users get frustrated as they cannot utilize the available data for business benefits.
For any business to succeed, data-driven decision-making is important not just for strategic decisions but also for operational and tactical decisions made by front-line executives and managers. Viewer analytics may be valuable to management for long-term planning, marketing managers for budgeting, copywriters for designing messages and media planners for actual campaign execution. Though analytics tools need to empower all these users, they often fail to do so. Either the tools are not capable of handling day-to-day granular queries of the users or the users lack the expertise required to work on these complicated tools.
Data will fail to serve its business purpose if BI and analytics tools cannot meet requirements of performance, scale and ease of use.
Most analytics solutions perform well when the same questions are asked repeatedly, but they fail to support out-of-the-box thinking where business users come up with questions that were never asked before. They find it difficult to scale up to meet new requirements and cannot deliver the performance expected for effective decision-making.
New dimensions are continuously being added to the data storage, and data volume is increasing at an exponential pace. BI and analytics tools that perform well on today’s data volume and size are sometimes not future-ready.
When data scales up, they fail to respond in time, making analytics slow and unusable. Even if they manage to scale, the cost of scaling is sometimes so high that it does not make business sense to continue to invest. The ideal tool should be able to incorporate new data generated by changing viewing behavior with ease and speed.
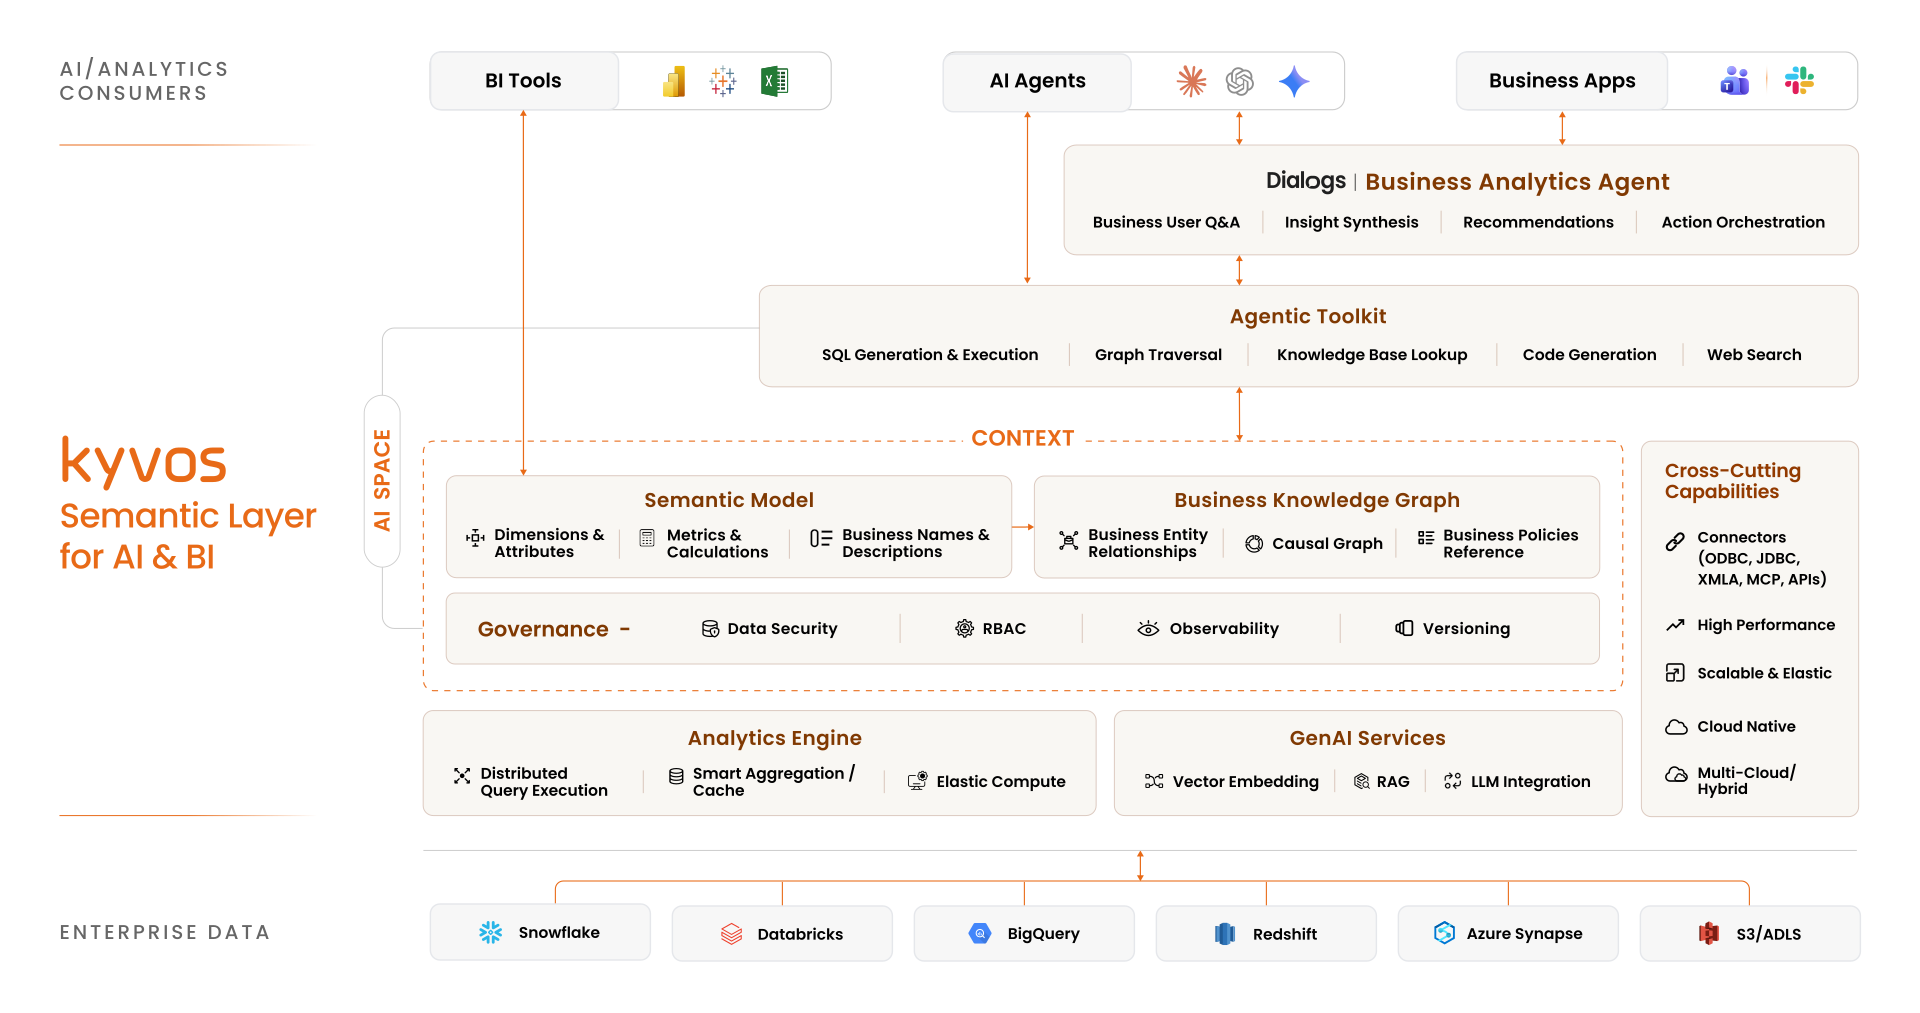
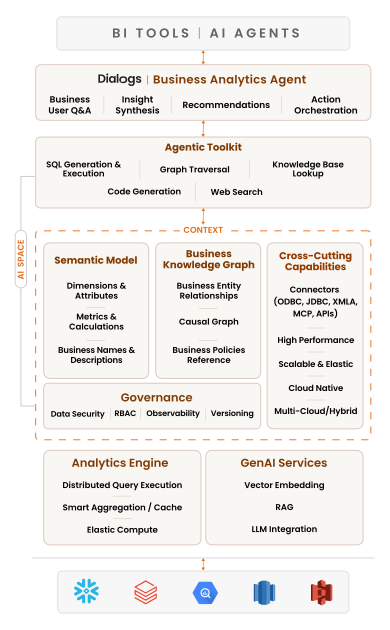
Kyvos semantic layer empowers business users with hyper-speed analytics on all of their viewership data, both on the cloud and on-premise data lakes. The platform bridges the gap between existing BI or analytics tools and this data with a unified consumption layer in their data stack.
Kyvos’ revolutionary AI-powered smart aggregation technology accelerate analytics on huge datasets with no scalability barriers. As a result, enterprises can access large volumes of new and historical viewership data seamlessly and work at a speed that was impossible before.
Kyvos provides instant analytics to business users by allowing them to query viewership data, irrespective of its size, volume or complexity.
Kyvos bridges the gap between technology limitations and business needs with instant analytics. Built for modern data platforms, the platform enables scalable deployments to thousands of users across an enterprise. It delivers near-linear scalability with minimal performance degradation for new data, dimensions or users while providing quick response times and high availability. High-performance and unlimited scalability help organizations gear up for the future, where viewership patterns will get more complicated, and the data volumes will expand.
Kyvos allows business users to leverage their existing BI tools for analyzing viewership data. It supports all BI tools like Tableau, Power BI, MicroStrategy, Excel, SSRS and Looker, as well as data science engines like R and Python.
Analysts can use modern data platforms while working with the tools they like. Business users across the organization can use different tools depending on their expertise. For example, the senior management and marketing team can use BI tools like Tableau, whereas the media and sales executives can use Excel to pull out the needed information. Kyvos leverages existing cloud or on-premise platform for storing its smart aggregates.
This minimizes cost and maintenance overheads as additional infrastructure is not required. With no data movement, our platform maintains security at the data storage layer itself.
Analysts and business users can dig into any data quickly and get to the core of the problem as Kyvos supports multiple dimensions and unlimited granularity. They can get instant responses to pointed questions like how likely it is for a 25–35-year-old professional living in California to view a 60-second ad on YouTube vs. a 3-minute ad on a popular news site from 8:00 AM to 9:00 AM on a weekday?
Since analysis is fast, business users can drill down, slice and dice billions of rows of viewership data interactively without being worried about its size or complexity. This provides a deep understanding of the viewers’ behavior and helps predict how they will respond in the future.
An organization that intends to use viewer analytics for instant analytics must begin by identifying its own needs. Some questions to ask are:
Businesses also need to evaluate whether historical trends, real-time monitoring or both play a larger role in their media strategy.
Kyvos semantic layer unifies diverse and complex data sources into a single source of truth, bridging the gap between modern data platforms and BI tools.
With AI-powered smart aggregation, Kyvos transforms fragmented viewership data into connected intelligence. It delivers the speed, scale and simplicity to understand audiences deeply, optimize ad performance and craft personalized viewer experiences.